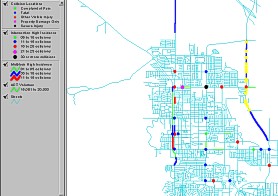
One of the most useful and impressive features of the Traffic Collision Database is the ability to produce detailed, color-coded GIS maps for a number of collision categories. After running a General Query or queries for Intersection High Incidence, Midblock Historical, and Midblock High Incidence, corresponding GIS maps are automatically updated in ESRI's ArcView™ which is included with the Collision Database. (A screen shot of a map in ArcView™ is shown at the top left. The layout, color coding, and the type of information to be viewed are all customizable.)
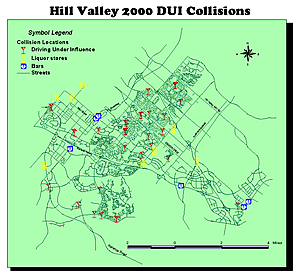
The query results are displayed on a citywide GIS map, and you can show individual locations as well as highlighted intersections and midblock segments. You can run, for example, a query to show all collisions involving school-age pedestrians on a specific day of the week and have the collision locations appear on the map. Even midblock collisions are located along the streets automatically. Clicking on an individual location yields the relevant information for that collision record.
Queries can be run to highlight the top ten intersection locations or midblock segments (or any number you prefer), ranking them by collision rate or number of collisions. Full color layouts are easily printed with maps, graphics, compasses, legends, and additional text and graphics. This ability to map collision records can help cities and departments understand collision patterns better and help them work towards preventing collisions.