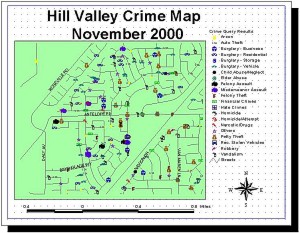

One of the most useful features of the Crime Analysis Database is the ability to run queries and reports and then show the results in detailed, color-coded GIS maps. The Crime Database comes with ESRI's ArcView™, a GIS mapping program that creates fully customizable maps. Users can define the size, layout, and color of the maps, as well as the types of data to include or exclude, which street names appear, how large of a cross-section of city they wish to show, and other features such as map legends.
Crime categories such as burglaries, child abuse, assault, homicides, hate crimes, petty theft, drug-related offences, and much more can be mapped out with corresponding, easy-to-read symbols. Users can also define a range of dates to map. All in all, the GIS mapping capabilities assist police departments and cities in defining where crimes occur, the density of specific criminal activities, and the range of crime types for a given city. Like the rest of the Crime Analysis Database, the GIS mapping component can help police work towards preventing crime.
As a whole, the Crime Analysis Database is constantly being improved and expanded. This year, the Database will include threshold settings, forecasting, and spatial analysis. As far as the threshold settings are concerned, the user can, for example, set the following parameters: Front Door Kick-In, Residential Burglary, 5, 30 Days. This will notify the appropriate people whenever there are five residential burglaries in which the front door is kicked in as a method of entry within a 30 day period. Forecasting will take crime series and forecast when and where they are most likely to be repeated. And spatial analysis will show crime densities for various crime categories throughout a particular jurisdiction.