The Graphs and Charts section of the Traffic Collision Database provides informative and effective visual layouts for collision data and records. By specifying a location and a range of dates, the user can produce graphs and charts for highest degree of injury & primary collision factor, collision type & involved with, weather & lighting conditions, degree of injury, and more.
The query parameters can be limited further according to hit and run, collision type, lighting, day of the week, and other options.
Each graph and chart can be easily printed or saved.
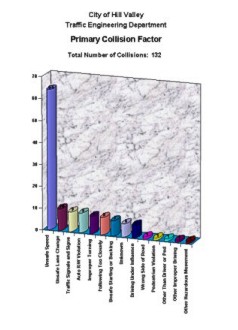
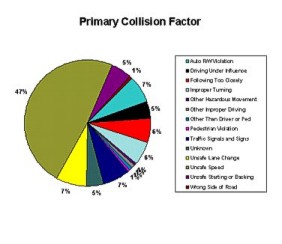
The images to the left show the graph and chart for primary collision factor for a specific location and a specific period of time.